
What is P/E Ratio in Layman’s Language?Also explain P/E TTM
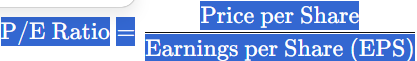
P/E Ratio stands for Price-to-Earnings Ratio.
It tells you:
“How much are you paying for ₹1 of the company’s profit?”
🧠 Simple Example:
Let’s say a company’s:
- Share price = ₹100
- Earnings per share (EPS) = ₹10
Then:
P/E Ratio=100/10=10
So, you’re paying ₹10 for every ₹1 the company earns annually.
🛒 Think of It Like This:
Imagine you’re buying a tea stall that earns ₹1 lakh profit every year.
- If someone is selling it to you for ₹10 lakh → P/E = 10
- If they ask ₹20 lakh → P/E = 20
A lower P/E means you’re paying less for the same profit.
✅ What is an Ideal P/E Ratio?
There’s no single perfect number, but here are some good guidelines:
| P/E Ratio | Meaning | Interpretation |
| 5 – 10 | Low | Could be undervalued or in a slow-growth industry |
| 10 – 20 | Fair | Reasonable for stable or moderately growing companies |
| 20 – 30 | High | Usually for fast-growing or high-demand businesses |
| >30 | Very High | Often overvalued unless strong future growth is expected |
🧾 Ideal P/E for a Good Investment
| Company Type | Ideal P/E |
| Mature, stable companies (like insurance, utilities) | 10–15 |
| Moderate growth companies (like FMCG, banking) | 15–20 |
| High-growth or tech companies | 20–30 (or more) – if growth is real and sustainable |
⚠️ Important Notes:
- Low P/E isn’t always good: It could mean problems in the company.
- High P/E isn’t always bad: If the company is growing fast, high P/E may be justified.
- Always compare P/E with:
- Industry average
- Company’s historical P/E
- Company’s growth rate (PEG Ratio = PE ÷ Growth Rate)
🎯 Final Thought:
P/E tells you how expensive or cheap a stock is compared to its earnings.
But it’s only the first step — always check growth, debt, management, and cash flow too before investing.
What is P/E TTM
P/E TTM stands for Price-to-Earnings ratio (Trailing Twelve Months). It’s a financial metric used to evaluate a company’s valuation.
Here’s what it means, broken down:
- P/E (Price-to-Earnings) Ratio:
This is calculated by dividing the current market price per share by the earnings per share (EPS).
- TTM (Trailing Twelve Months):
This indicates that the EPS used in the calculation is based on the last 12 months of actual earnings (not future or projected earnings).
Example:
If a company’s stock is trading at $50 and its EPS over the last 12 months is $5, then:
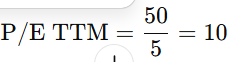
So, investors are paying $10 for every $1 of earnings the company made over the past year.
Why It Matters:
- A higher P/E TTM can suggest a stock is overvalued or that investors expect high future growth.
- A lower P/E TTM might indicate a stock is undervalued or that the company is facing challenges.